About Amanda Callahan

Amanda is a senior analyst. In her spare time, she plays the bassoon, crews on a hot air balloon team, and, according to her Spotify account, listens to more Beatles music than 99% of other Spotify users. Having grown up in Wisconsin, Amanda loves the Green Bay Packers, eating fresh cheese curds, and she once ran over a cow in a Saturn Ion. She also enjoys bird watching, bowling, and is working on her private pilot certificate.

Sampling Methods

It’s a perfect spring day. There you are, merrily going about your business of changing the oil. But wait! You forgot the oil sample bottle! A quick scramble to retrieve the bottle gets you back to the oil just as the last of it drains out.

Can you pour a sample out of the filter instead? What if you add a quart a few days before sampling – how does that affect the analysis? What about something like an engine flush – should you use one? Do they work? Your investigative team at Blackstone experimented, and we’ve got answers. While these tests probably won’t qualify for a peer-reviewed journal, they’re a good guide to what you need to know about sampling.

This is part two in our series on sampling methods. Part one, on engine flushes and their effects on analysis, can be found here. Part two covers common sampling scenarios: does it change the results if you take a sample from the filter or dipstick? What if you add fresh oil before sampling? Is it a problem if the oil gets dark right after putting it in the engine? That last question isn’t about sampling methods, but people ask all the time and your investigative team at Blackstone wanted to know, so read on for answers.

Does it matter how you sample?

Our instructions for sampling say to catch a sample as the oil drains from the pan, but that doesn’t always happen. Does it change the date if you take a sample from the filter or pull it through the dipstick?

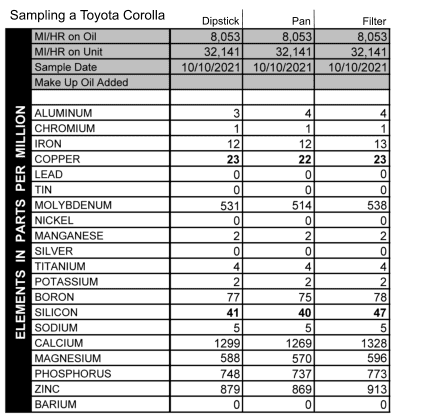
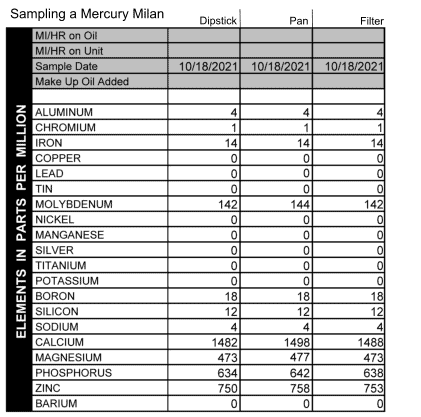
In short: no. Figures 1 and 2 illustrate three consecutive samples taken from two different cars: Figure 1 is from a Toyota Corolla and Figure 2, a Mercury Milan. The column on the left is a sample taken through the dipstick. The middle column was oil taken while the oil drained from the pan. And the right-hand column is oil taken from the filter. Results for a Toyota Corolla, sampling from the dipstick, pan, and filter

Results for a Mercury Milan, sampling from the dipstick, pan, and filter

Results

The samples are unremarkable in that there’s less than 1 ppm difference in the wear metals across all three samples. The sampling method seems to have no impact on the metals that show up in analysis.

The Corolla in Figure 1 does show a higher silicon reading in the sample taken from the oil filter, but perhaps that was due to either dirt collected by the filter that ended up back in suspension in the engine oil, or sample contamination – we did have to use a bit of creativity in removing that filter from the engine, as the filter was overtightened and stuck. (If you’re wondering, we stabbed it with a screwdriver to give us more twisting leverage – we did not sterilize the screwdriver before surgery, so it’s entirely possible some silicon was introduced in that process.)

Does adding fresh oil impact the test results?

It makes sense that that adding fresh oil will dilute the wear numbers. But how much do the numbers change? And does it matter when you add the new oil? In theory, if you have a 4-quart sump, adding one quart of fresh oil shortly before the oil change would mean that your engine’s metals are diluted by 25% from their previous numbers.

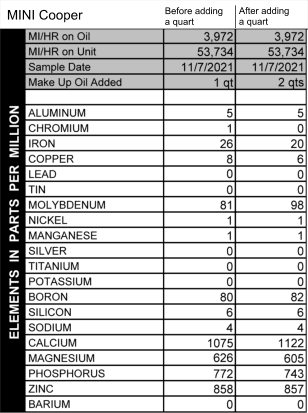
To test this theory, Ryan Stark, Blackstone’s president, pulled a sample from his MINI, then added a quart and sampled again to see how the numbers changed.

Results for a Mini Cooper, sampling before adding a quart of fresh oil, and after

Crunching numbers

The MINI has a total capacity of 4.5 quarts, so the one quart he added comprised 22% of the total engine oil capacity. Most of the metals decreased by approximately the same percentage: iron dropped from 26 ppm to 20 ppm (a decrease of 23%), copper dropped by 25%, from 8 to 6 ppm. If we assume that chrome actually changed by less than 1 full ppm, due to rounding, the average change in metal works out to around 25%, which is what we’d expect from adding a quart of oil to this engine.

The only other appreciable wear metal in his sample is aluminum, which, interestingly enough, read at 5 ppm in both samples, showing no change at all. We couldn’t let that element go without a little suspicion – why didn’t it change when the other metals did? As it turns out, the actual number our spectrometer reads goes four decimal places to the right. We round to the nearest whole number on the report, but if we pull the full spectral data from those tests, aluminum read at 5.4290, and in the second test aluminum read at 4.8995. Both readings were rounded to 5 ppm in the report, but the full spectral data shows a slight change between the two samples, an improvement of 9.7%. So aluminum did change with the added oil, just not quite as much as the other metals and not enough to show on one of our published reports.

The “when” factor

There are other variables to consider like how far into your oil change you add the oil, and how much oil you add. If a quart of oil is added at the 3,000-mile mark and you run your oil 10,000 total miles, the dilution factor probably is going to be a lot different than adding a quart just before changing the oil. That’s harder to test for because there are too many variables to isolate.

So this isn’t the be-all-end-all of the dilution question, but it at least gives some insight into the fact that the metals could be diluted if you’re adding oil, especially if you’re doing it right before an oil change. It is a good idea to add fresh oil when low, even if you’ll be changing the oil soon. Running an engine on a diminished oil capacity isn’t great.

Why does my used oil look so dark?

We get a lot of questions from people who do an oil change then notice that their oil is dark immediately afterward. Is it a problem?

To get to the bottom of this question, we conducted two oil changes on two separate vehicles, idled the fresh oil for five minutes, then sampled and examined the new oil.

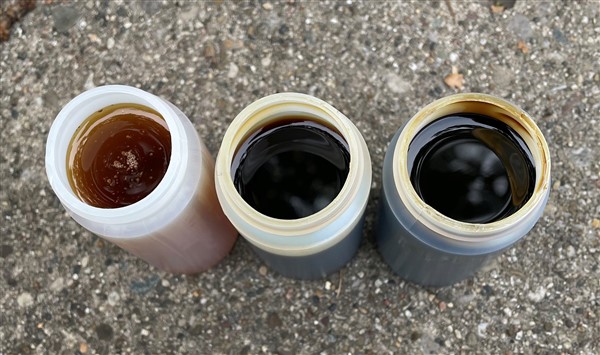
The color of three samples of oil from a Toyota Corolla
FIG 4: Toyota Corolla – Left, new oil. Middle, oil after 5 minutes. Right, used oil.

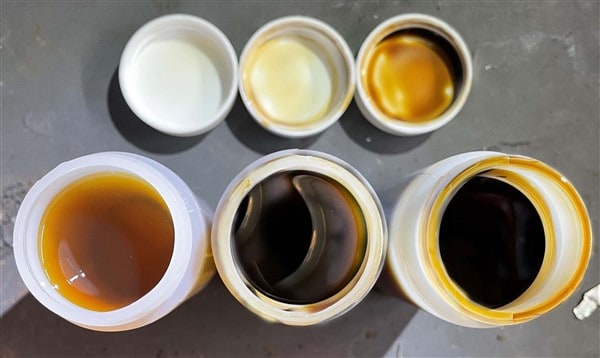
The color of three samples of oil from a Mercury Milan

FIG 5: Mercury Milan – Left, new oil. Middle, oil after 5 minutes. Right, used oil.

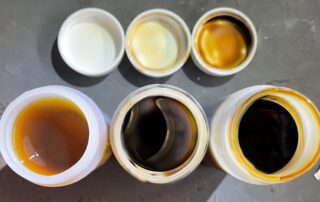
In both cases, the oils were quite dark after just five minutes of use. In Figures 4 and 5, the virgin oil is pretty obvious, but there’s not much difference between the new oil with 5 minutes on it and the oil with several thousand miles on it. In terms of the overall sample color, it’s quite hard to tell.

Results

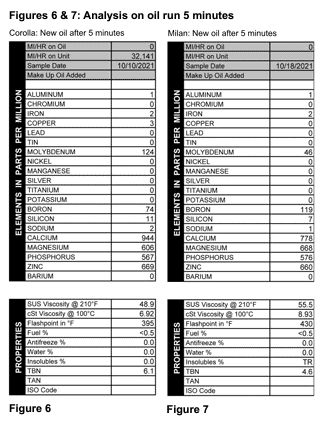
So does the dark oil indicate anything? Figures 6 and 7 show the analytical results of the new (but darkened) oil after being run 5 minutes in two different engines.

Oil reports from the Corolla and Milan on oil run 5 minutes

Both oils look very clean in testing, with minimal insolubles, no contamination, and very low metal counts. You might note that the metals do not start at 0 ppm – that’s because you never get 100% of the old oil out when you do an oil change. There’s always some carryover from one oil change to the next, and you can see that in the results.

So is it a problem that the oil looks dark right after an oil change? Nope. It’s fairly normal for oil to darken quickly after an oil change. If anything, it seems to suggest that the oil is doing just what it’s supposed to be doing: collecting contaminants and combustion by-products and keeping them in suspension so they can be removed when the oil is changed.

Sampling Methods: Go for it!

In the end, although we give you guidelines about how to sample, your method really doesn’t make too much difference. If you don’t catch a sample mid-stream, just let us know when you send the oil in and we’ll take that into account when we do the analysis. If anything unusual shows up and we think it might be related to something you did, we’ll let you know in the comments.

By |2024-09-19T09:14:05-04:002023|Articles, Gas/Diesel Engine|Comments Off on Sampling Methods

The Fuel Experiment

When I first started at Blackstone, one of the contaminants that intrigued me the most was fuel. I guess I don’t know why finding fuel in people’s oil surprised me. Maybe I thought fuel and oil were separated by a giant wall somewhere in the engine. Or maybe (probably) I really didn’t understand engines very well to begin with and that only served to fuel (ha!) my interest in the contaminant.

We test for fuel using the Cleveland Open Cup method. Basically, we record the temperature at which the vapors from the oil ignite. All oils have a specification for what the flashpoint should be. When it’s lower than that, it’s because a contaminant is present. About 98% of the time, that contaminant is fuel (sometimes a solvent or refrigerant will lower a flashpoint, but rarely in gas or diesel engines). Basically, the lower the flashpoint, the more fuel you’ve got.

We can accurately measure fuel down to less than 0.5%, so that’s the lowest fuel measurement you’ll see on your report. The upper limit of what we can accurately read is 10.0%. If you’ve got more fuel than 10.0%, you’ve got bigger problems to worry about than the actual quantity of fuel in the oil.

When the opportunity came up to write an article for the newsletter, I readily accepted and already knew I wanted to write about fuel. In fact, I was not just going to write about it–I was going to get to the bottom of it. I was going to discover what causes fuel dilution and what causes fuel to disappear.

The plan

The guinea pig was my trusty Kia Optima (2.4L, 4 cylinder). I use my Kia mostly as a daily driver, traveling about seven miles to and from work each way. I love to travel and occasionally I get in a trip to Wisconsin or Iowa. By the time I started my quest to debunk fuel, I’d done a few samples with my Kia and only a trace of fuel had ever turned up so I didn’t have any known fuel system problems to contend with.

I decided to take the highway route home every day to ensure that every day I would cook out any extra fuel that was present in my oil. My 40-minute drive consisted of some city streets with a few stoplights at the beginning and end of my trip, and mostly sustained highway speeds through the middle of my trip.

Start your engines

The first thing I wanted to test was how much fuel entered the oil simply from starting the engine. Many people believe that starting an engine is one of the most taxing and wear-producing events throughout the engine’s life. To make that process easier, engines tend to start slightly rich (more fuel, less air). So, I set out to find out exactly how much fuel my car dumps into the oil upon startup.

After letting the engine sit all night, I took a pre-experiment test sample (to ensure no fuel was present) then I started my engine one, two, and three times, sampling after each event. The results were surprising. So surprising, in fact, that I re-ran this test two more times to make sure my results were correct.

The pre-experiment test sample revealed a flashpoint of 360ºF (fuel at <0.5%). Okay, good. No measurable fuel was present, which is exactly what I was hoping for since I’d taken the highway route home the night prior.

After one engine start, the flashpoint read 385ºF. Wait a minute. That’s higher than the pre-sample, so there’s definitely still no measurable fuel present. Okay, maybe that was just an anomaly.

I started the engine again (for a total of two engine starts in a row). The flashpoint measured 380ºF. That meant the flashpoint was heading in the expected direction (lower flashpoint = more fuel), but still, the flashpoint wasn’t low enough to show any significant fuel.

After the third start in a row, the flashpoint read 375ºF, which was again lower (and heading in the expected direction), but not low enough to show any measurable fuel. So all four of my samples from that morning had the same fuel measurement: <0.5%.

I was stumped. I was so certain I’d have some fuel in my oil! So I ran the test again and the same thing happened: no measurable fuel present in any of the samples. I re-ran the same exact test once again, and once again got similar results.

I decided perhaps my Kia was just very good about keeping fuel out of the oil, so I took my husband’s car with a supercharged 2.0L Ecotec engine for a day and tried the same test. The results? Same thing: no fuel, with slight fluctuations in the flashpoint.

Then I had an “a-ha!” moment. Maybe the fuel just wasn’t getting a chance to seep down past the rings into the oil. I had been sampling immediately after starting, so maybe that’s why no fuel showed up. So I ran the test again, only this time I let my engine sit overnight after the three starts.

In the pre-experiment test, the flashpoint measured 370ºF, showing <0.5% fuel. I started my engine three times and immediately after the third start, the flashpoint measured 360ºF, which was lower but still not low enough to show any measurable fuel.

Then I let the engine sit all night and sampled before work in the morning. That test revealed a flashpoint of 365ºF; still no measurable fuel. By this point I wanted to find a brick wall to repeatedly press against my forehead in a semi-violent manner. I was frustrated, confused, and worried that I’d have nothing to write about.

I suppose if we wanted to get into semantics, we could talk about the slight differences in flashpoints as showing some fuel, though it takes a 20ºF drop in flashpoint (for gasoline engines) to show 1.0% fuel dilution. So that means the 5ºF drops in flashpoint I’d noticed likely show just 0.25% fuel.

Does starting cause fuel? Perhaps. I did find slight dips in the flashpoint, though as I’ve mentioned, 5ºF isn’t enough to show any serious contamination. Maybe four starts would have given me enough of a drop in flashpoint to get a decent amount of fuel in the oil, but really, who starts their engine four times in a row? Honestly, who starts their engine even three times in a row on a regular basis? I wanted these to be relatively real-world scenarios, so I couldn’t justify four starts in a row, and I figured three was pushing it.

Idling

I couldn’t get any serious fuel to appear in my oil from starting the engine, so I figured I’d try idling. For a week, I drove the same highway route home, let my engine sit all night, then in the morning I’d take a pre-experiment sample (to confirm no fuel dilution was present to begin with), and then I’d sample after a certain number of minutes of idling.

I tried a five-minute idle; no measurable fuel. The next morning, I idled for ten minutes and this time I had more success: 1.0% fuel had accumulated in the oil. You know, for someone trying to get fuel contamination in my oil, 1.0% isn’t an impressive amount, but it’s more than I’d gotten before. I figured I was on to something with the idling, so I tried 15 minutes the next morning, but much to my dismay only 0.5% fuel turned up. After 20 minutes of idling, still only 0.5% fuel.

Does idling cause fuel dilution? It would seem so, except that there’s a cut-off point in there somewhere. This is just hypothetical, but maybe after ten minutes the engine heats up enough that it either starts cooking off the excess fuel dilution or it just stops pumping in extra fuel. I’m not even sure one of those is the answer, but it’s the best guess I can come up with.

Shopping for science

With my newsletter article deadline quickly approaching, I had to come up with one last-ditch effort to get a bunch of fuel in my oil. Think of this as Custer’s Last Stand (except with less bloodshed).

For one afternoon, I vowed to do everything “wrong” in order to get as much fuel as possible in my oil. I was going to run a bunch of errands, idle my engine excessively, make frequent starts and short trips. The best way I could think to do this (without just circling around my block several times in one afternoon) was in one, massive shopping trip.

I did about 40 minutes of highway driving Saturday evening then let my Kia sit all night. Sunday after church (we took the other car to ensure the consistency of my results), I went on my scientific shopping trip.

Here’s the summary of my trip. I spent a total of about six hours shopping Sunday afternoon. In those five hours, I started my engine seven times, idled at the ATM for about 2 minutes and traveled a grand total of 6.4 miles. The longest drive was from my last stop to home, which was about 2.5 miles.

I spent a fair amount of time at each stop in hopes that my engine would stay relatively cool (so as to not burn off fuel). When all was said and done, I left my engine sit overnight and sampled in the morning before work. The flashpoint read 375 ºF: <0.5% fuel.

Usually, I’m fairly good at things when I put my mind to it, but when it comes to getting fuel dilution in my engine oil, I failed. Then again, if you’re going to fail at anything, this is a good thing to fail at.

What happened?

So why couldn’t I get any serious fuel dilution? I have a couple of ideas. First, I think my Kia is just too smart. It has an on-board computer that senses things like ambient temperature, engine temperature, and elemental composition of the exhaust gas, and it uses these things to calculate the exact amount of fuel it needs to operate most efficiently. So my engine never puts in more fuel than it needs, and therefore that fuel doesn’t end up in my oil.

Second, I think ambient temperature probably has a lot to do with it. I did most of my testing in May and June in temperatures were almost always above 70ºF. We tend to see more fuel in the winter months, and I suspect that if I’d done my testing in the winter, I might have had different results. I’ve heard that on a cold day, fuel from the air/fuel mixture will condense on the cylinder walls almost instantaneously. Those beads of fuel will sit on the cylinder walls for a brief moment until the piston rings scrape that fuel down into the oil. Maybe I’d get more fuel in my oil in winter, but I’m not sure I’m willing to do these experiments in the dead of winter in the name of science. If I do, you’ll hear from me again and I’ll let you know what I find out.

Does the fact that I couldn’t get any fuel in the oil mean that idling, city driving, and frequent starts do NOT cause fuel dilution? We don’t think so. In some cases these things can cause fuel contamination, especially in carbureted engines.

We saw it with our own eyes several years ago, when an intern did a similar experiment out in the parking lot. He took a sample from his 1978 Ford pickup truck when it was cold, and that oil had no fuel in it. Then he started the engine and took another sample right away, and presto! Fuel contamination at 1.3%. So start-up can indeed cause fuel to enter into the oil, but newer engines may be better at avoiding excessive contamination.
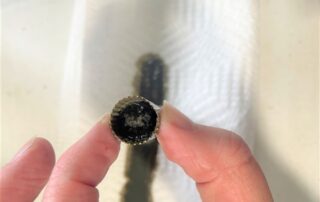
Since fuel often comes and goes, we still believe operational factors are likely sources for fuel dilution, though perhaps injector problems are responsible for more of the fuel we see in new engines than we originally thought.

Now here’s the big question: if fuel is present at 2.0% in your sample, does that mean you have a problem? Not necessarily. Just because my Kia didn’t produce fuel dilution doesn’t mean your Honda, Ford, GM, Volvo, or other engine won’t. Every engine operates a little differently and uses a different calculation to figure out how much fuel to spray into the cylinders. Some engines tend to run a little richer for some reason or another.

Of course, if your engine doesn’t have an on-board computer, you won’t have the opportunity to benefit from its fuel-reducing powers, so fuel may be more prevalent in your samples. It should be noted that I didn’t have the opportunity to test a carbureted engine or a diesel engine, which would almost certainly render different results. So I can’t say what’s normal for those types of systems.

So how do you know if fuel is a problem? There isn’t a one-size-fits-all answer. Whether or not fuel is a problem depends on your circumstances. Some engines will always see some fuel dilution because of the operation they see or the type of engine they are. Turbo and supercharged engines, for example, have higher compression, which means more blow-by, and we sometimes see that raw fuel blowing past the rings. In small amounts, that can be fine. In larger amounts, it’s probably not.

If you start to notice that fuel is increasing wear or diluting the additives in your oil, that can be a sign that fuel’s a problem. If you notice increased wear and lingering fuel dilution, it may be time to get the fuel issue taken care of. Finally, if you notice your engine is “making oil” (the oil level seems to be rising on the dipstick), you might have a fuel system problem. I can tell you this: if you have a Kia 2.4L 4-cylinder engine and you find fuel at more than 1.0%, you may have a problem. You might also have an e-mail in your inbox from me asking you for pointers.

By |2024-09-19T09:21:21-04:002023|Articles, Gas/Diesel Engine, Lab Tests|Comments Off on The Fuel Experiment

Better Mileage with Synthetic?

One afternoon a customer emailed us and said he gets better mileage when he’s using synthetic oil. To be honest, we were skeptical. If you’ve been with us long enough, you know we generally think that oil type doesn’t matter. Use Oil A for 5,000 miles and do a sample to check your metals, then use Oil B for the same miles and resample. Most people will find that their engine wears just the same regardless of oil brand. But here is an angle we hadn’t tested — is fuel economy affected by your choice of oil? We decided to try and find out.

Designing the experiment

When we first started talking about a fuel economy experiment, we came up with a lot of questions. How will we know how much fuel we’re actually using? How will we take into account tire pressure and other things that can affect fuel economy? Do we need to take into consideration the natural expansion of gas at different temperatures?

We eventually decided on the following plan. It’s probably not scientific enough for a MythBusters special, but it’s about as good as we could get without installing special pumps and meters, and it should be repeatable if you want to give it a shot in your own vehicle.

Counting miles was the easy part — we just recorded miles at every gas fill-up. Figuring the “per-gallon” was a little trickier, since we don’t really have an accurate way to measure fuel consumption.

In an episode of MythBusters where they were doing something that involved calculating miles/gallon, they took an old clunker, removed the hood, and rigged up a container that measured fuel consumption to the milliliter. That’s a little more involved than we wanted to get, especially since our guinea pigs are analysts Amanda and Alex’s daily driver vehicles.

We ended up recording the number of gallons needed to fill up at the pump. We decided to resist the urge to “top-off” the tank when filling and just stop pumping whenever the pump stopped. Is this a perfect measure of fuel usage? Certainly not. Every pump could be a little different in its stopping point depending on the day, the pump, the volume/speed of fuel dispensed, ambient temperature, and so on…but these things are impossible to control in the real world.

We decided to do ten gas fill-ups on each type of oil. With ten fill-ups, we’d have enough data to take into account some of those variables mentioned above that we can’t control. We also made a note to monitor tire pressure, though that varied so little that we thought it negligible.

Royal Purple vs. Quaker State

Amanda started with Quaker State Advanced Durability 5W/20. The price at O’Reilly Auto Parts was $5.29/quart or $23.99 for a handy 5-quart bottle, which is just perfect for her Kia, which takes 4.8 quarts of oil. She ran that oil in her car from May to June 2013. In ten gasoline fill-ups, she ran 3,703.7 miles and used 131.858 gallons, for a fuel economy of 28.09 miles/gallon.

She decided that 3,703.7 miles was too early to change her oil, so she kept running that oil for a total of 6,333 miles and changed the oil on July 27, 2013. The result was some good wear numbers (see figure 1, F66495).

On to the synthetic! Royal Purple 5W/20 costs $9.79/quart at O’Reilly Auto Parts and does not come in a handy 5-quart jug, so we ended up paying $48.95 for oil on this oil change. Amanda ran this oil from the end of July until October, going 3,829.2 miles and using 137.002 gallons of fuel, for a final fuel economy of 27.95 miles/gallon, a decrease of 0.5% compared to the Quaker State conventional.


Oil Price/5 gal. Miles Gals. MPG
Quaker State 5W/20 $23.99 3703.70 131.89 28.08
Royal Purple 5W/20 $48.95 3829.20 137.00 27.95


Amanda ran the Royal Purple a total of 14,277 miles before changing it (we’re all for getting our money’s worth out of an oil change!), and ended up with a little more wear than usual (figure 2, G22246).

The two oils are very close in terms of fuel economy, with the conventional Quaker State slightly edging out the more expensive Royal Purple. But in the spring of that year she was doing a little more highway driving than in the fall, with a few trips between Illinois and Green Bay, Wisconsin, and so on. Even so, the added cost for the oil itself almost certainly defeats any slight improvement in MPG she might have gotten. So let’s look at Alex’s numbers.

Mobil 1 vs. Mobil Super & Advance Auto Parts 5W/30

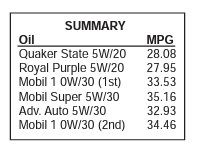
Alex spent $34.85 for five quarts of Mobil 1 Advanced Fuel Economy 0W/30 at Wal-Mart and ran the oil from January 2013 to May 2013. He traveled 3,061.1 miles, used 91.3 gallons of gas and ended up with a fuel economy of 33.53 miles/gallon.

Then he bought five quarts of Mobil Super 5W/30 conventional oil for $18.10 and ran 3,234.9 miles on 92.0 gallons of fuel from June to October 2013, for an average fuel economy of 35.16 miles/gallon¾a difference of 4.9% in favor of the conventional oil.


Oil Price/5 gal. Miles Gals. MPG
Mobil 1 AFE 0W/30 $34.85 3061.10 91.30 33.53
Mobil Super 5W/30 $18.10 3234.90 92.00 35.16


Alex noted that his engine tends to get better fuel economy in general in the warmer months than the colder months, so he repeated the experiment again the following year, using Advance Auto Parts 5W/30 conventional oil from February to March 2014, getting 32.93 MPG.

He then ran Mobil 1 Advanced Fuel Economy 0W/30 from May to August, getting an average fuel economy of 34.46 miles/gallon. In this case, Mobil 1 did beat the conventional oil, but his mileage still wasn’t as good as on the original run of Mobil Super 5W/30 conventional, and the added cost of the oil negates any extra miles-per-gallon.

Alex mentioned that on synthetic oil his engine seemed to burn less oil, but since that wasn’t the point of the experiment, we didn’t get too deep into trying to quantify that.

Synthetic or conventional?

So…which oil to choose? We get asked this question hundreds of times a year on the phone, in e-mails, and written on oil slips. And honestly, from a wear standpoint, we don’t find a lot of difference between conventional and synthetic oils. Some engines may run better on one than the other, or maybe you find that your engine uses less oil on one or the other, but these things are hard to quantify from our end. Chart showing a summary of 6 oil brands and their average MPG.

There are so many factors that affect how your engine wears, what kind of mileage you get, and how long your engine will last that we could never issue a blanket one-size-fits-all statement saying “You should use X.”

We did not find that synthetic oil gave us better fuel economy, but that doesn’t mean that you won’t. Feel free to try this experiment at home and let us know what you find. Or, if you’re not experimentally-inclined and you’re wavering about what oil to use, feel free to use whatever fits your wallet. Any API-certified oil is going to be quality oil, and your engine should be happy with whatever you choose.

By |2024-09-19T10:08:27-04:002023|Articles, Gas/Diesel Engine|Comments Off on Better Mileage with Synthetic?

Under Pressure! (Part 2)

In Part 1 of this saga, our flying club’s newly installed O-360 lost oil pressure in flight with a student pilot at the controls. After a brief landing then an immediate a go-around (you read that right), and a fair amount of sweat and tears – but fortunately no blood – we found the engine had digested an errant paper towel, which was blocking the suction screen.

Crud in the pan

The hard part begins

Now that we knew the engine actually did suffer a loss of oil pressure (it wasn’t just the gauge) and the filter analysis showed that some damage had been done, our next step was to figure how to proceed.

We consulted as many experts as we could and received suggestions ranging from “just go fly it” to “pull a cylinder and look for damage” to “overhaul it” and everything in between. The jury was out, and we had to decide whose suggestion to follow.

Lycoming has a convenient Service Bulletin about what to do if you find metal in the oil filter, so we started there. Service Bulletin 480F suggested, based on the amount and size of metal in the oil filter, that we remove the oil pan and check for metal. That seemed like a good idea; not only were we still troubleshooting mechanical wear, but also, we didn’t know how much paper towel was still in the engine.

It took two solid days of work to remove, inspect, clean, and reinstall the oil sump, which still had paper towel in it. Once that was done, after finding no large pieces of metal in the sump and being sure there weren’t any leftover paper towels in the engine, we did a 30-minute ground run then drained the oil, and cut the filter to check for metal.

Intestinal fortitude

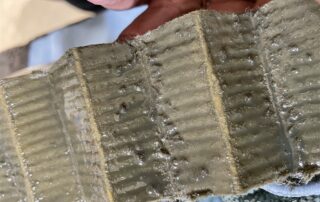
The oil analysis was unremarkable, but the oil filter report noted 10-15 non-ferrous metallic flakes per pleat with a few dozen larger pieces that had scrape marks on them. So – a little better than

Metal from the filter, magnified in analysis

before, but certainly not clean. But this was only a 30-minute ground run compared to the 20-some hour sample. Were the improvements from the shorter oil change, or an actual improvement? We didn’t know.

Now, I’ve been an analyst at Blackstone for over a decade. I’ve helped countless customers diagnose their own engine issues and told people to go fly it and check back. But there isn’t any amount of intestinal fortitude that prepares someone for the reality of experiencing a problem, diagnosing engine damage, doing what you can to fix it, and know that the next step is to go flying and see how it goes.

The two A&Ps on the field agreed that if we made it past the first 10 hours (if) without any oil pressure issues, then we should be fine. “But watch that oil pressure,” they cautioned.

Going up

We took all the precautions we could: we went up in pairs (so one person could watch the oil pressure), we selected calm days, affording us four runway options for an emergency landing, and we stayed within glide distance of the airport for 10 long hours.

I am glad to say that those first 10 hours were uneventful. Oil pressure remained strong, the engine ran great, and we had no issues. With each hour that passed, our confidence grew, so we eagerly sent another oil and filter sample for analysis, hoping for hard data to bolster our confidence.

The oil analysis was unremarkable, but the filter – not great. Approximately 30 variously sized non-ferrous flakes were present per pleat, along with one piece of steel.

Not what you want to see

This wasn’t what we were hoping for, but this oil run was 10 hours long as opposed to the previous 30-minute ground-run sample. There was bound to be more metal, right? Regardless, there was still more metal after 10 hours than there was in our previous 50-hour samples, so we weren’t in the clear yet.

Our solution? Do another 10-hour oil run for an apples-to-apples comparison. At this point, with 10 hours of uneventful flying under our belt, our confidence was starting to grow, so we ventured out a little from the airport environment. After 10 hours, we sent the oil and filter for analysis, fairly confident that this second sample would reveal the improvement that was bound to come.

Instead, we received the disheartening news that “the overall quantity and size of the non-ferrous flakes was similar to the previous filter.” Dang.

Hard discussions

We debated what to do next. Are we throwing money away on oil and filters when we might need an overhaul anyway? Do we keep wasting filters when the nationwide filter shortage might ground us anyway? Do we run 25 hours, despite not seeing an improvement in the metals?

We reconsidered an earlier suggestion to pull a cylinder and look for crank/bearing damage, but that might raise more questions than answers: what should a 1500-hour crank/bearing look like? How will we know if the damage is excessive without pulling all four cylinders and comparing? And at that point why not just overhaul?

Opinions varied among our club members. One thought we were overreacting and that a paper towel couldn’t cause engine damage. Others of us were more cautious, remembering how little metal our engine used to make in 50 hours. As a group, we exchanged some vibrant text conversations as we decided how to proceed.

With our concern about irreversible, ongoing damage, we opted to do another short 10-hour oil change to try and limit further damage and get another good comparison to gauge progress. I was afraid that if this sample didn’t come back cleaner, we’d start considering exploratory surgery and watch the summer tick by from the ground.

Baby steps

We knocked those 10 hours out in less than a week and had results early the following week. I jokingly told my coworker that I’d bribe him with beer if he gave us a good enough report that we wouldn’t have to ground the aircraft for the summer.

Still with the metal

As it turned out, no bribery was needed: the oil analysis came back clean and the filter report contained good news: less metal than before. Finally! Maybe everything was going to be okay. Granted, we’re not totally out of the woods yet – we’re still monitoring and we’re going to change the oil in 25 hours, but at least we’ve got data that suggests we’re past the worst of it. If the numbers are good in 25 hours, then we’ll try 50. That night of the improved report was the best night’s sleep I’d gotten in months.

Lessons learned

Hindsight is always 20/20, as they say, but looking back I think there are several lessons to be learned.

First, when you’re troubleshooting a problem, do your research and get as much data as you can. It honestly shocked me how many different opinions we received. At one point I called Lycoming. They called me back several days later, and after listening to my story the tech said we needed an overhaul.

I replied, “Well in the week I was waiting for you to get back to me, we did a 30-minute ground run, tested the oil and filter, and we’ve since flown a couple of uneventful hours, as per SB 480 and we’re planning on flying a total of 10 hours before retesting.”

He said, “Okay, that’s good. Do that and proceed as planned.”

In less than five minutes he went from telling me to overhaul to “go fly.” There’s a vast dichotomy there. I get that there’s a lot of liability in aviation, but that just makes it harder to make good, educated decisions. We did a lot of research, gathered data, and consulted with as many people as we could to make the best decision for us. Do your homework.

Second, remember that you have many tools in your toolbox for diagnosing problems. Our oil reports came back clean all along – it was the filter analysis that was showing metal. Oil analysis measures the microscopic particles in the oil; the filter/screen is where you’ll see visible metal. Always cut your filter open, and use oil analysis in conjunction with other tests (like borescope and compression checks). The more data you have, the better decision you can make.

Third, as we said last time – trust your gut. If your intuition tells you something is wrong, don’t ignore it. But the reverse is also true: after all those hours of flying the pattern with strong oil pressure, good RPMs, and normal oil temps, we had a strong feeling that our engine was going to be okay – we just had to wait a few oil changes for the data to support our intuition.

And last but certainly not least – keep the damn paper towels far away from your engine!

By |2024-09-18T14:21:50-04:002023|Aircraft, Articles|Comments Off on Under Pressure! (Part 2)

Under Pressure! (Part 1)

About a year ago I started a flying club at my local airport with three other pilots – that was a long and interesting process that I won’t go into here – but after a few months of trying to get the right people together then struggling to buy an airplane in a hot market, we were able to purchase a 1965 Cessna 172 F with the Air Planes 180hp Lycoming O-360-A4M upgrade, with about 1300 hours SMOH. The pre-buy inspection went well and I had the honor (with another member) of flying our new ship home to Illinois from Florida.

As a 12-year analyst at Blackstone Laboratories, of course I did an oil and filter analysis as part of the pre-buy inspection. With that data in hand and considering how active our new aircraft was, we decided to proceed with Lycoming-recommended 50-hour oil changes right off the bat.

The first few oil analysis reports were excellent, and the oil filters came back nice and clean. The first time we pulled the oil suction screen we found a small amount of fibrous material in it, but the previous owner confessed that they hadn’t ever pulled the screen, so we assumed the debris was probably years – if not decades – old. We didn’t worry too much about it. When the next screen came back clean, save for a mere spec of carbon, we forgot about the fibrous debris entirely and happily went about enjoying our new bird.

Lost oil pressure

That is… until March 29th, when one of our newer student pre-solo members texted that, 10 minutes after takeoff, the engine lost oil pressure. He and the instructor landed without incident and reported everything looked ok, hoping it was a bad gauge.

The questions from the other partners streamed in: where were you? How was the engine running? How was oil temperature? The student pilot clarified: they took off to the north, climbed to 5,000’ to work on maneuvers, and when they did the cruise checklist they noticed the low oil pressure. He reported returning to the airport immediately with no issue. The engine ran great the whole time, and oil temperature was fine. No apparent oil loss.

I was out having coffee with a friend at the time, but my heart sank and I couldn’t focus on anything else, so she and I ended up going to the airport, with an A&P friend on the phone to look for something obvious, like an oil leak at the oil pressure gauge or where the line comes through the firewall. I didn’t find anything, but I wasn’t too discouraged: I knew we had a lot of things to troubleshoot before suspecting engine damage, so I tried not to jump to any conclusions.

filter pleats with slimy debris embedded in t

Filter pleats with slimy debris embedded

Initial shock and investigation

The following day, our club maintenance director – under the watchful eye of our A&P – started working through the troubleshooting list. We quickly determined it wasn’t the gauge, and it wasn’t the line, so the easy, cheap fixes were off the table.

Now concern was starting to mount; the deeper we had to dig, the deeper our pockets were going to have to be. We’re a new club, already operating on a shoestring budget, so we didn’t have time or money for costly repairs. But we had a problem to solve.

The next step in our troubleshooting process was to start looking for a problem. We drained the oil, pulling an oil sample in the process, and we removed, cut, and inspected the oil filter. The only abnormalities were some clumpy, slimy looking lumps (see figure 1) and a giant piece of carbon (figure 2). The carbon was large enough to wonder if something similar had gotten stuck in the oil pressure relief valve, so we pulled the oil pressure relief valve off hoping for a big piece of carbon to be our easy culprit.

Much to my dismay, the oil pressure relief valve was totally clean.

Looking at the screen

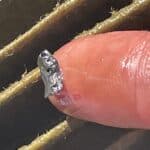
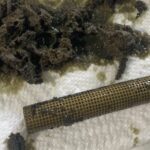
Later that night, with the oil drained, the filter cut and the oil pressure relieve valve not the suspect, I pulled the oil suction screen. My heart sank. The screen was completely blocked by fibrous

Debris on the end of a fingertip

Debris on the end of a fingertip

material. It looked like the same stuff we found in our earlier oil change, only a whole lot more of it. The pickup screen was so caked full that I had to use a screwdriver to pry the debris out of the screen (figures 3a and 3b).

That’s when concern really started to set in: we actually did lose oil pressure, and there could be some serious damage here.

A few days later the oil analysis and official filter report came back: the oil report was unremarkable, but the oil filter report was disheartening. Our engine had gone from making “no appreciable metal” in 50-hour oil change intervals to making “non-ferrous metallic flakes at an approximate rate of 20 pieces per filter pleat” in a matter of 20 hours. Great. Now what?

Fact-finding

The filter report stirred up more questions than it did answers. The next step in the process was to figure out how much damage was done, what that fibrous material was, how it got there, how much remained, and, most importantly, what to do next?

The fibrous material turned out to be the easiest question to answer – it was a paper towel. When examined under a microscope, it had the very distinctive dimpled pattern you see on “quilted” paper towels (see figure 4). Once we identified the contaminant, the next step was figuring out how it got there.

Fluffy stuff that came out of the suction screen

Fluffy stuff that came out of the suction screen

Interestingly enough, the previous owners provided the answer in the photographs they shared with me during the pre-buy. A couple of photos showed the process of swapping the original O-300 with the O-360. In figure 5 you can see a couple of paper towels sticking out the back of the engine where the magnetos should be. I believe that some (or all) of that paper towel somehow ended up getting stuck in the engine – either someone turned the prop and the gears pulled it in, or some of it got wet with engine oil and broke off into the engine.

You did what?

There’s another interesting twist to this story: as we were trying to figure out how long the engine ran with no oil pressure, we looked at the flight track on FlightAware. As reported, the plane took off to the north, climbed to about 5,000’ turned around then did a 360’ turn, presumably to lose altitude. Then there’s a normal approach to landing and…a go-around.

Wait, what?

That’s right – a go-around. With no oil pressure measuring on the gauge. When we confronted the CFI about the flight track, he confirmed: the student pilot was flying, and he came in too high and too fast to salvage the landing, so a go-around was initiated. *face palm*

Why didn’t the CFI take control of that flight and land? Because he assumed it was a gauge problem. Oil temp was fine, the engine was running well, so he didn’t worry about it.

magnified quilted paper towel

Ground up paper towel under a microscope

The good news was that the CFI confirmed that oil pressure wasn’t lost entirely (as the student pilot had reported). It was only lost when at idle. If there was some power, there was some (albeit not much) oil pressure reading on the gauge. With that information, and knowing the engine hadn’t seized entirely, we were hopeful the engine damage was limited.

Moving forward

So, we’ve finally found the culprit, and now the long road to recovery begins. The main takeaway from this part of the story is, if you see anything unusual at all – anything – get on the ground as soon as possible. Don’t assume a low oil pressure reading is a bad gauge, and don’t fly when something might be wrong. Don’t dilly-dally, waiting for traffic to clear. Declare an emergency if you have to and diagnose with two feet firmly planted on terra firma.

Check back in the next newsletter as we discuss the confusing, gut-wrenching process of figuring out whether we could salvage the engine!

By |2024-09-18T14:22:01-04:002023|Aircraft, Articles|Comments Off on Under Pressure! (Part 1)
Go to Top