In the Thick of it!

Analyst Chris Tulley hits the Hot Rod circuit and reports the effects on his oil

In the spring of 1995, the editorial staff of the tenured HOT ROD magazine had a decision to make. The publication was set to host a run of brand-new HOT ROD Power festivals, muscle car meet-ups where locals could show off their own rides, see cutting-edge tech from manufacturers country-wide, and dream of new, faster ways to drain their bank accounts. Said magazine staff wanted to be a part of the fun and show off their own project cars, which would prove difficult, as they were based in Bakersville, Ca., while the inaugural Power festival was set in Norwalk, Ohio. The solution; drive their heavy Chevys, rat rods, and budget dusters over 2,000 miles to Ohio, then say a quick prayer to Lee Petty and the motor spirits that they could make it back home. 200 other drivers joined the ranks, sparking the birth of the HOT ROD Power Tour. “My car doesn’t just have to sit at a car show, I can drive it.”
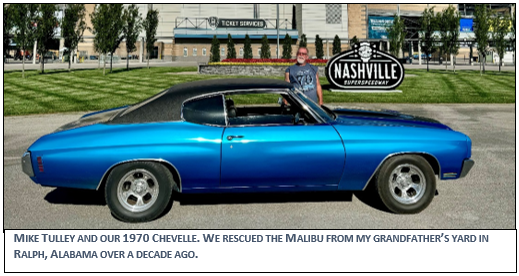
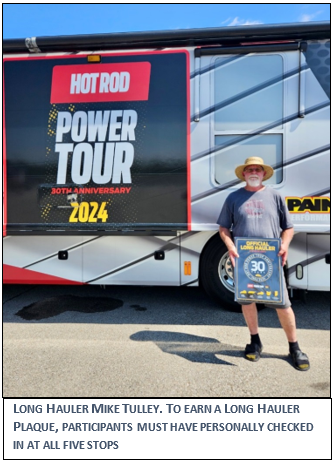
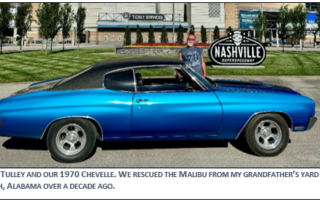
So here’s the gist. Five racetracks in five days, spanning stretches of American highway and automotive history. The 30th annual HOT ROD Power Tour just wrapped up June 15th, where over the course of five days, over 5,000 cars, including my own 1970 Chevelle, and at least 100,000 attendees came together to sweat out 1,800 miles of tour.

Bouncing from drag strip to road course, this year’s tour kicked off at the National Corvette Museum in Bowling Green, Ky., where the tour ended in 2023. Bright and early Tuesday morning, the caravan headed south to Nashville Superspeedway, where participants could spin a few laps. Day three; The University of Louisville. Next stop, National Trail Raceway, outside of Columbus, Ohio. The checkered flag flew over mecca; the Lucas Oil Raceway in Indianapolis. That’s where the tour will start in 2025.

I wanted to know how a tour like this would affect our favorite topic; my oil. I have been blessed to go on about 10 Power Tours so far with my father and our Chevelle. This is the third engine in the car, and I’ll have a fourth upgrade next year. This year we ran a 1969 Chevy 355cid small block. So I wanted to know how the oil looked to start, and what condition would it end up in nearly 2,000 miles later.
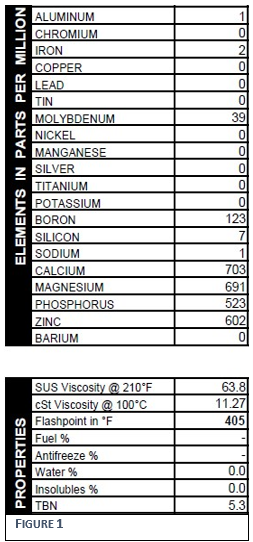
First, we took a sample of virgin Valvoline Full Synth 10W/30 (Figure 1). Calcium, a detergent-dispersal additive, was the leading element at 703 ppm. Magnesium, zinc, and phosphorus all read above 500 ppm, and there was some boron and molybdenum in the mix as well. Pretty typical cocktail of additives, overall. The TBN started at 5.3. The higher that TBN reads, the better active additives can stave acidity and corrosion.

For the second sample (Figure 2, pink column), we drained the engine, added the Valvoline, and immediately pulled a sample via the dipstick. There was some iron and lead present from the previous fill, at 16 and 28 ppm, respectively. Carryover is inevitable, as oil changes fail to get every last drop out of the galleys channel of the block. We had used an oil additive recently, something along the lines of Lucas Oil, so calcium bumped up to 1,453 ppm. Zinc and phosphorus jumped up a little as well, but magnesium dropped by over 50% to 298 ppm. The viscosity increased as well, as did the amount of insolubles, so maybe that magnesium was grabbing carbon build-up to keep it from settling and coagulating. At least, that’s my idea of what a detergent dispersal does. Why the magnesium decreased is beyond my chemical knowledge. I’m more of an expert at “press gas, go fast”, it seems.

Sample number three (Figure 2, blue column) looked better than I expected, which is good for the engine, but it doesn’t make for the most exciting article. We pulled the sample in the middle of the week, then topped of the engine with about 4 ounces of fresh Valvoline. This sample saw roughly 900 miles of highway and backroads, and only an hour of road course time. As much as I wanted to drag race throughout the week, my tire budget didn’t approve.

The most notable addition to this analysis was fuel dilution at 1.3% by volume. Did the engine get above 190°F during this run? Obviously. But think of how many times the engine was stopped and restarted. Between gas stations, hotels, breakfast, and the many times I decided I needed a better parking spot, I bet we cranked the engine at least 15 times a day. That’s ample opportunity for fuel to enter the block. It wasn’t enough fuel to thin the viscosity below specifications for 10W/30, which is the main concern with fuel in oil. Fuel wasn’t present in any of the other samples. Iron, from steel parts like cylinders, shafts, and lifters, is the wear metal that tracks closely with use, and it increased by just 4 ppm. Lead dropped by 2, showing that the bearings didn’t wear a bit. That’s encouraging, because I certainly got on the throttle.

The final sample (Figure 2, orange column) reveals a cool instance of cause and effect. So imagine thousands of hot rods coming through a small town in southern Kentucky. Every red light, every stop sign was backed up for miles. There wasn’t a single Slim Jim or Diet Coke left in the county. I have radiator for a big block, and two electric fans to combat engine overheating. At one point, in the bumper to bumper traffic, my fan relays blew, and my engine temps rose to nearly 260°F, roughly 40° too high for comfort. As we were literally sweating out the situation, my oil was unable to cool the engine, an imperative feature that could have resulted in a tow-ride home.

After replacing the fuses, we never had another mechanical issue. The viscosity of the sample came back thicker than expected for 10W/30, an obvious sign of the high heat. Now if you think a little heat can impair classic American ingenuity, you’d be right in a lot of cases. But not mine. Iron read at 20 ppm once again. Sure, take into account up to 5% deviation from the testing equipment. Maybe iron was actually at 18 or 22 ppm. Either way, running at high temps without a fan did cause my oil to thicken a bit, but it didn’t hurt the wearing parts at all. Not a single increase in wear metals down the line.
The last kicker was the TBN reading. We only tested it on the virgin and the final samples, to see an exact start and finish. Remember when I said the TBN read at 5.3 in the virgin sample? It ended at 5.2. 1,896 miles later, and the active additive in the oil only degraded by a fraction of a decimal. The low end of a TBN is 2.0. After that, an oil can turn acidic, leading to corrosion.

Not only is that a testament to the additive package in Valvoline (not sponsored, but willing), but the overall efficacy of the engine and the American spirit.

We’ll see how next year goes, but no matter what, my Pops and I are in it for the long haul. Happy 30th Anniversary, HOT ROD Power Tour!

 

By |2025-01-14T15:23:48-05:00January 14, 2025|Articles, Gas/Diesel Engine|Comments Off on In the Thick of it!

The Price We Pay to Soar

How does flying in the Air Race Classic affect engine wear?

Let’s start this story with a question.

Mark has a truck – let’s say it’s a red F150. Mark consistently runs the engine 70 MPH on the highway every day on a commute to work with nothing in the bed.

Mark’s buddy Dave lives next door, and Dave also has an F150 (this one’s blue), with the same engine, and he works in the same place as Mark. So the two guys have the same exact commute, except Dave constantly hauls 8 kegs of beer to and from work, and he always pulls a trailer that’s loaded up with about a thousand pounds of dumbbells and free weights.

Which engine looks better in oil analysis? Mark’s, right? His engine sees much lighter use—no heavy loads in the bed and no towing, so he’ll have less metal in the oil. That makes sense. The same thinking goes if you compare driving 50 miles on the highway vs. 50 miles on the race track: track use is harder, and it’ll make your engine wear more. And indeed, the data backs this up.

But is that true for airplane engines?

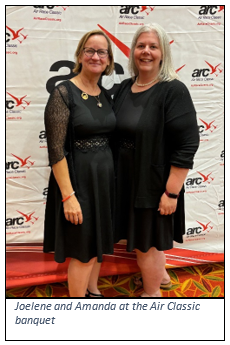
We don’t see quite as many samples from aircraft engines that are run harder than others to be able to determine whether there’s a difference. Either you’ve got an aerobatic airplane that does mostly aerobatic flights, or you’ve got a trainer that sees everything from countless touch and go’s to multiple cross-country flights on every oil run. Maybe you’ve got your business plane or transport plane doing mostly long-haul flights and not much else (imagine doing aerobatics in your family hauler, with the kids strapped in the backseat). So while we naturally expect harder use to result in more metal, that’s a little harder to quantify in the aviation world than it is in the automotive world. But then there’s Joelene.


Joelene

Joelene is a close friend of mine who has been sampling her 1978 Bonanza’s Continental oil with us for several years. She keeps her IO-520 active enough that corrosion has never really been a problem. Joelene does a nice mix of cross-country flights from the Midwest down to Texas, has the right instruments to keep her current and proficient, and she’s not shy about helping with Young Eagles flights at nearby airports. Overall, most of the flying she does is relatively easy cruising without a lot of hot/cold cycles, and she’s got several pages of nice, stable trends to back it up.


The Air Race Classic
A couple years ago, Joelene got into racing her Bonanza. In 2022, she participated in the Air Race Classic, a ~2,200 nautical mile, four-day race for teams of two (or more) women pilots. The race traces its roots back to the days of Amelia Earhart and her contemporaries, when women weren’t allowed to race with men, so they started their own cross-country race.

This past summer, I was her teammate in her Bonanza. Our race started in Carbondale, Illinois, and ended in Loveland, Colorado, with stops in Indiana, Michigan, Ohio, Minnesota, Missouri, Oklahoma, and Kansas along the way. All told, we traveled 2,269 nm in just over 19 hours, going full-throttle the entire time. This was a little different than the normal kind of flying Joelene does.


Looking at the Numbers
After her first race in 2022, Joelene and I looked at her engine oil test data to try to figure out how much “damage” was inflicted on the engine parts by participating in the race. The biggest thing we had noticed was that make-up oil had gone up from 2.5 quarts in 27 hours to five quarts in 34 hours. There was a little more nickel, too, but nothing noteworthy. Realistically though, one data point isn’t exactly enough to come up with any hard-and fast conclusions about the engine.

Guess we better keep racing.

So after being a part of the Air Race Classic this year, she now had two sets of data to compare to her normal trends. When I asked Joelene if I could use her data for this article, she replied, “Yes! As long as you don’t tell me I can’t race my Bonanza anymore!” We would never.


Non-Racing vs. Racing Wear Numbers
Joelene has a total of 19 samples on file with us over the last five years, and two of them are the race samples. It isn’t a huge sample size, but it’s worth taking a look at.

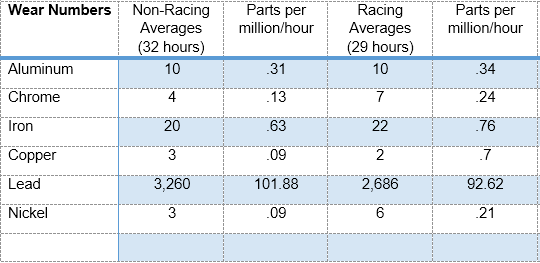
She averaged a typical 32-hour oil change interval over her 17 non-racing sample. While racing, the average interval is 29 hours. Metal counts are in parts per million.

Aluminum, chrome and iron inched up a bit, copper and lead both managed to improve, and nickel doubled. So, in this case (lead and copper being the exceptions), racing does cause a little more wear for Joelene’s Bonanza. Enough to stop Joelene from racing next year, or raise any red flags on our end? Nope, it’s not that significant. Keep in mind we’re still talking about microscopic metals in parts per million, so we’re not talking about a lot of metal overall—the harder use does affect the engine, but not to the extent that she needs to change what she’s doing.

Why did copper improve? We don’t know. Lead, on the other hand, is a bit more explainable. It comes from 100LL fuel blow-by, which tends to read higher when flying at higher altitudes and lower at lower altitudes. With less air pressure on the crankcase at higher altitudes, more blow-by escapes past the rings, and you end up with more 100LL in the oil.

As part of her racing strategy, Joelene tends to fly quite a bit lower than normal so that she doesn’t spend as much time climbing at slower groundspeeds (since you don’t often make up a lot of speed with tailwinds on shorter legs). Most of the legs of our race were flown at the absolutely lowest FAA minimum safe altitude during the race, which was quite a rush! And also, that means lead, from blow-by was a little lower.

Still with us? There’s just one more factor to note.

Oil Consumption
One of the biggest things Joelene noticed when she’s racing her IO-520 and running wide open the entire time, compared to when she’s flying a bit more tepidly, is that her engine consumes a good deal more oil. How much more oil? When Joelene isn’t racing, her engine burns an average of 1 quart of oil every 25.7 hours, or 0.04 quarts/hour. When she is racing, oil consumption increases to 1 quart every 4.8 hours, or 0.17 quarts/hour. She has a 12-quart sump, but she keeps the oil level at about 10 quarts — anything above that just ends up on the belly on the plane.

So, when Joelene is racing she’s roughly refreshing 50% of the oil during a given run, which means the metal counts we provided above would essentially be diluted by about 50% at the end of the run.

To get the exact dilution factor we’d have to figure out how many hours into the oil run she added each quart of oil, then figure out how much time that oil spent in the engine, and do a whole lot more math. Suffice it to say, the additional make-up oil is making her racing numbers look better than they actually were. It potentially doubles the wear rates over her non-racing samples. I won’t put those numbers here, so Joelene doesn’t have to look at them in black and white (and since the numbers, technically, would be just an estimation anyway), but you can imagine what they’d be: 50% higher.


Conclusion
Did the engine make more metal? Require more make-up oil? Yep, it did. Makes sense, right?

Joelene only gave me permission to write this article and use her data as long as I didn’t tell her she couldn’t race her plane anymore. You’re reading this article, so the conclusion is that I’m not going to be telling Joelene not to race her plane anymore. And rightfully so.

Even with all the data and trends, the metals we’re reading are microscopic, in parts per million, so the increased wear rates aren’t significant enough to suggest we’re looking at part numbers or any serious engine damage. The wear rates are a little higher than average, but that’s nothing compared to all the fun she has racing—the challenge, the excitement, the camaraderie, and the memories. Worth it!

When we have automotive customers whose engines wear slightly more than average because their engines are used for off-roading, or hauling, or even a lot of idling, we remind them that the metal is probably just the small price you pay for all the fun you’re having. And that’s the same thing we’d say to Joelene with confidence: yes, your engine wears a little more on the races, but not nearly so much that we think you should stop racing. Besides, it’s better than *not* flying your airplane and letting it corrode from the inside out. Might as well fly it!

We’re excited to cheer on Joelene (and the rest of those amazing ladies) in next year’s race, and we are looking forward to seeing that little sample bottle of black gold to see how the engine fared.

By |2025-01-14T14:48:45-05:00January 14, 2025|Aircraft, Articles|Comments Off on The Price We Pay to Soar

Spectrometry: The Marvel of the Lab

We occasionally get questions about how oil analysis works. You send your oil to us and you get a report back, but what happens in the lab? Is it magic? Some sort of voodoo? What happens to the oil that allows us to determine what’s in it?

At the heart of oil analysis is a spectrometer. It is the machine that allows us to quantify wear metals, additives, and contaminants in oils, making oil analysis a useful service in predicting potential problems in engines and machines of all types.

The plasma in the process

A spectrometer can be aimed at a star to determine what elements may exist in the star, if all the star’s light is being generated by the star (rather than reflected off the star). Spectrometry works on the same principle, but we have to first create the light. We do this by converting the actual oil into light energy. This is done by injecting the oil into something called plasma. You can think of plasma as a flame, since it looks like a green flame. But plasma is much hotter than a normal flame, and it needs to be in order to do its work. The plasma we use has a temperature of about 10,000° C. Plasma is actually the highest state of energy (the states of energy being solid, liquid, gas, and plasma).

Different types of plasma have been used over the last several decades that oil analysis has been commercially available. Early on, plasma was electrically generated as an arc. The drawback of an electric arc is that as it is generated, it can vary in intensity because the electrical part generating the arc erodes. The erosion causes changes in system resistance, resulting in variable plasma intensity. When using plasma to read the intensity of light from elements, it’s best if the plasma’s light is constant. Otherwise, errors can be introduced into the process.

Inductive coupled plasma, known in the trade as ICP, works by converting argon gas into plasma. So long as the argon pressures and flow rates don’t change, and the power causing the plasma’s generation is steady, the intensity of the plasma stays the same. This gives ICP spectrometry the industry gold star for incredible accuracy.

The rainbow connection 

To understand what happens next, think of a rainbow. When you see a rainbow, what you’re really seeing is moisture droplets in the air acting as prisms to separate the various wavelengths of light into individual colors that can be seen by the human eye.

A spectrometer uses this same principle. A prism inside the machine takes the “light” that’s generated by injecting the oil through the plasma and separating it into the different light frequencies of the elements. Each beam of light is then directed to a tiny slit on what is called an aperture plate. The aperture plate is a thick metal device, about 10 inches wide by 18 inches long, and the slits engraved in it are finer than a human hair. The aperture plate allows us to measure the intensity of each beam, using a device known as a photomultiplier tube.

A photomultiplier tube senses light and reacts to its intensity by vibrating faster as the light intensifies. Voila! By placing a photomultiplier tube at one of the slits on the aperture plate, we can get a digital readout of the intensity of light for any particular element in an oil sample. However, as amazing as this process is, the spectrometer is dumb as a box of rocks if the operator doesn’t install a program that will let the computer strut its stuff.

Let’s recap what we’ve learned so far. We know that argon is turned into extremely hot plasma, which burns the oil completely, turning it into light waves. The spectrometer refracts this light with a prism and then optically directs the distinct light frequencies of each of the elements to a slit in an aperture plate. A photomultiplier tube travels to each of the light slits and “reads” the amount of light there by vibrating. This marvelous arrangement still can’t tell us what we want to know without further instructions.

Setting the standard

The next step in determining what is in the oil (and in what quantities) comes in the form of “standards.” You can think of standards like your daily vitamin. Just as you can buy vitamins that contain a certain amount of iron, the iron standard (which is a liquid) contains a certain, “standard” amount of iron. You can buy standards that contain however much of any element you need.

Each standard has a certain amount of a particular element in it. If we want to know, for example, how much iron is in an oil sample, we need to give the spectrometer something to measure against. This allows it to know how many vibrations to count to determine how much iron is present. The first standard we use is a blank — that is, a zero standard — that has no iron in it. At the iron slit in the aperture plate, the photomultiplier tube vibrates at a certain rate per second. Then it remembers that rate as zero. Then, for example, a 100 ppm iron standard is fed into the machine, and again the photomultiplier tube vibrates, but this time at a faster rate. The machine remembers this rate is equal to 100 ppm. Setting the standards in the spectrometer is a process is known as calibration, and it’s something we do many times each day. It allows the spectrometer to know what standards it should be measuring against.

The spectrometer records each element’s information into a chart and uses the chart to determine how much of each element is an in actual oil sample. This process, where the photomultiplier tube travels to each slit and vibrates, repeats for each element we want to measure in an oil sample. The vibrations are translated to ppm (parts per million) readouts using the charts that were set up by the standards. Suddenly the spectrometer looks like a genius! It vaporizes the oil and tells us how much of each element is present in the sample.

There are 72 elements on the periodic chart that make enough light, when injected into the plasma, to be read on a spectrometer. Some elements make lots of light and are easy to analyze accurately. Others, like tin, make very little light and are more difficult to accurately gauge. This, along with differences in standards, calibration, and the set-up of different spectrometers, is the reason that you may find differences in the results coming from different laboratories.

A spectrometer is like your television or your car — you don’t have to understand how it works to use it. There is only one answer to how much iron, copper, or any other element may exist in an oil sample. We think ICP spectrometry has the best shot at giving you the correct answer. It is accurate and repeatable, which is a requirement for giving you an accurate appraisal of how your engine is doing mechanically based on its wear properties.

By |2024-09-19T10:44:38-04:00July 13, 2023|Articles, Lab Tests|Comments Off on Spectrometry: The Marvel of the Lab
Go to Top